Abstract
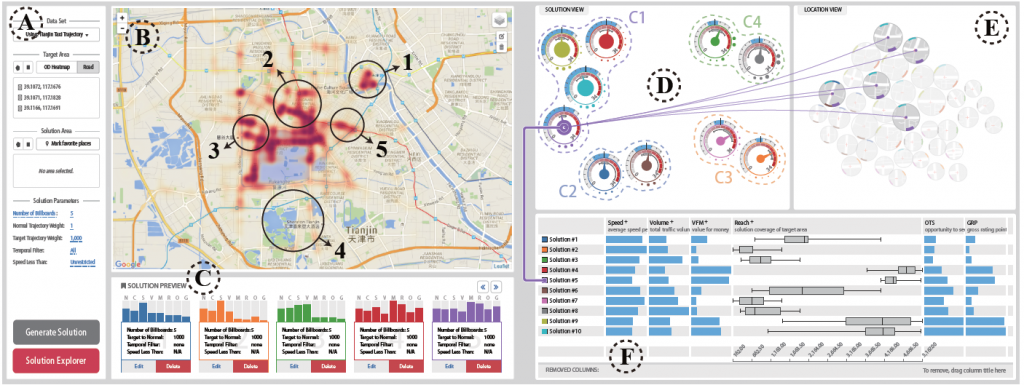
The problem of formulating solutions immediately and comparing them rapidly for billboard placements has plagued advertising planners for a long time, owing to the lack of efficient tools for in-depth analyses to make informed decisions. In this study, we attempt to employ visual analytics that combines the state-of-the-art mining and visualization techniques to tackle this problem using large-scale GPS trajectory data. In particular, we present SmartAdP, an interactive visual analytics system that deals with the two major challenges including finding good solutions in a huge solution space and comparing the solutions in a visual and intuitive manner. An interactive framework that integrates a novel visualization-driven data mining model enables advertising planners to effectively and efficiently formulate good candidate solutions. In addition, we propose a set of coupled visualizations: a solution view with metaphor-based glyphs to visualize the correlation between different solutions; a location view to display billboard locations in a compact manner; and a ranking view to present multi-typed rankings of the solutions. This system has been demonstrated using case studies with a real-world dataset and domain-expert interviews. Our approach can be adapted for other location selection problems such as selecting locations of retail stores or restaurants using trajectory data.